Best of the
Best
Editors' picks and our top buying guides


Best of the
Best
Editors' picks and our top buying guides
Latest

Best MacBook Air M2 Deals: Save Up to $300, Including on the Fleeting 15-inch Model
1 hour ago
Feeling Exhausted? Discover How Non-Sleep Deep Rest Can Revitalize Your Energy
1 hour ago
Evidence of Bird Flu Found in Pasteurized Milk. Here's What That Means
1 hour ago
Best Meta Quest 3 Deals: Bundle and Get a Free Game
2 hours ago
Windows 11's Start Menu Will Soon Have Ads: Here's How to Turn Them Off
2 hours ago
HVAC Maintenance Guide: What to DIY and When to Call a Pro
2 hours ago
AI Chatbots Need Large Language Models. Here's What to Know About LLMs
2 hours ago
Best Sony Headphones for 2024
2 hours ago
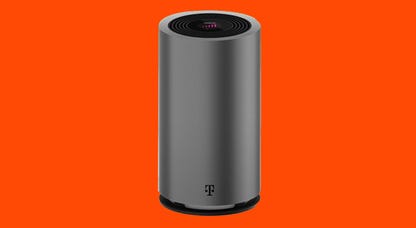
Best Mesh Router Deals: Spend Less to Upgrade Your Wi-Fi Experience
3 hours ago
Best Internet Providers in Roswell, Georgia
3 hours ago
Keep Your Home Safe With This Schlage Encode Smart Lock Bundle, Now 80% Off
4 hours ago
Apple May Give FineWoven Accessories 1 More Season
00:43 • 4 hours ago
Best USB-C Monitor Deals: Save a Pretty Penny on Top Brands, Like LG, Asus and More
4 hours ago
NBA Playoffs 2024: How to Watch Tonight's Games, Schedule, Matchups, TV Times
4 hours ago
US vs. TikTok: What Happens Next
02:14 • 4 hours agoMore to Explore
Reviews, advice and more from CNET's experts.


Get the best price on everything CNET Shopping helps you get the best prices on your favorite products. Get promo codes and discounts with a single click.
Add to Chrome - it's free!
Our Expertise
Expertise Lindsey Turrentine is executive vice president for content and audience. She has helped shape digital media since digital media was born.
0357911176
02468104
024681024
Featured in
Tech


Upgrade your inbox
Get CNET Insider
From talking fridges to iPhones, our experts are here to help make the world a little less complicated.
Featured in
Money


Crossing the Broadband Divide
Millions of Americans lack access to high-speed internet. Here's how to fix that.


Featured in
Energy and Utilities


Deep Dives
Immerse yourself in our in-depth stories.


Get the best price on everything CNET Shopping helps you get the best prices on your favorite products. Get promo codes and discounts with a single click.
Add to Chrome - it's free!
Featured in
Internet


Sleep Through the Night
Get the best sleep of your life with our expert tips.


Get the best price on everything CNET Shopping helps you get the best prices on your favorite products. Get promo codes and discounts with a single click.
Add to Chrome - it's free!
Tech Tips
Get the most out of your phone with this expert advice.


Get the best price on everything CNET Shopping helps you get the best prices on your favorite products. Get promo codes and discounts with a single click.
Add to Chrome - it's free!

Featured in
Home


Living Off Grid
CNET's Eric Mack has lived off the grid for over three years. Here's what he learned.