 Why You Can Trust CNET
 How We Test TVs
Call us biased, but we believe our TV reviews are the best on the planet. Here's how we nail the details.


- Although still awaiting his Oscar for Best Picture Reviewer, David does hold certifications from the Imaging Science Foundation and the National Institutes of Standards and Technology on display calibration and evaluation.
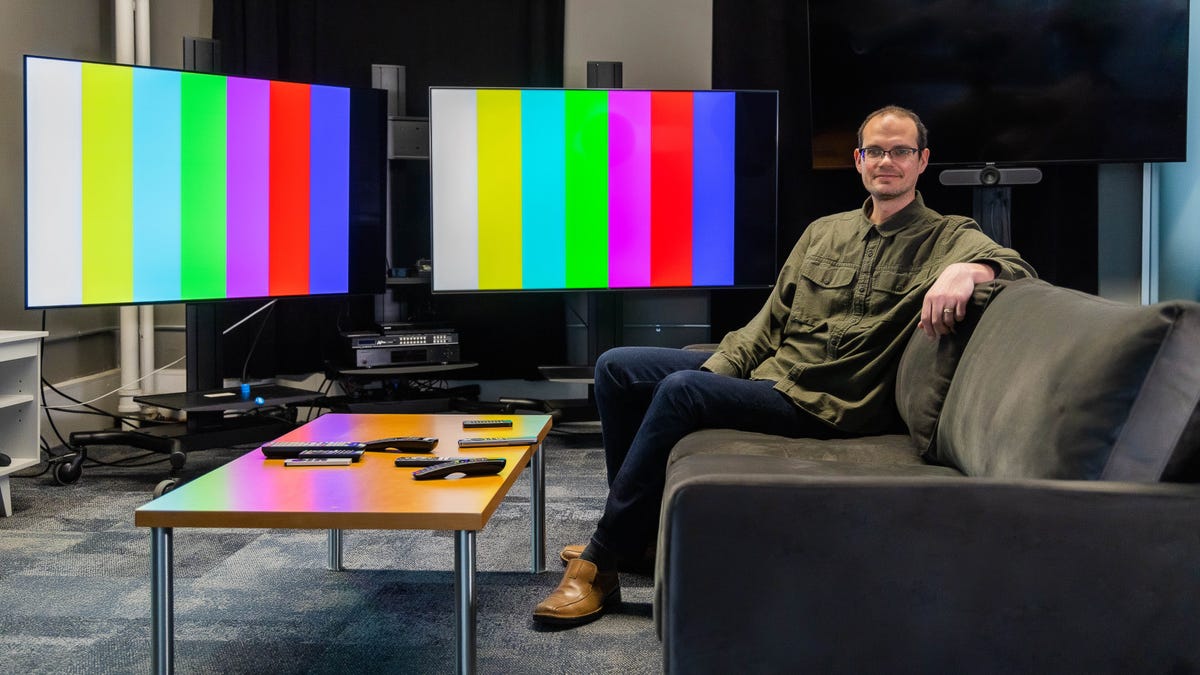
CNET's TV reviewer David Katzmaier in the lab.
Did you know CNET reviews TVs by comparing them directly in a side-by-side lineup, after each has been measured and evaluated with specialized equipment and software? Did you know the main instrument used to measure those televisions costs about $28,000? Did you know CNET TV reviews include gaming, 4K high dynamic range performance, off-angle and bright room evaluations, in addition to testing smart TV features, voice commands and more?
Yes, we're biased, but we consider CNET's TV reviews the best in the business. We've been doing it for more than two decades and we've honed the process to serve the ultimate goal: helping you figure out which TV to buy. We have a proven set of tools and procedures designed to arrive at unbiased results using video-quality evaluation tools, objective testing criteria and trained experts. Here's how we do it.
Test environment and equipment
The most important piece of test equipment is an experienced eye. Test patterns and the latest gear are no substitute for a knowledgeable evaluator with a background in reviewing similar types of TVs. CNET's head of TV reviews, David Katzmaier, has extensive experience reviewing and calibrating displays.

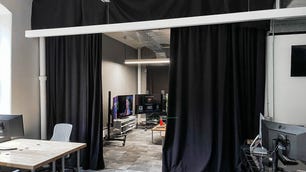
CNET's main TV lab is a large room where we set up comparison lineups. There are curtains over the windows to block out light -- or admit it for daytime viewing tests -- and a large curtain divides the space from the rest of the lab. Light control is a big deal for TV testing. We perform most measurements in complete darkness, as is the industry standard, to isolate the TV's output from ambient light. The walls are painted dark gray and the floor and ceiling are dark as well, to minimize contamination from light and maximize background contrast.
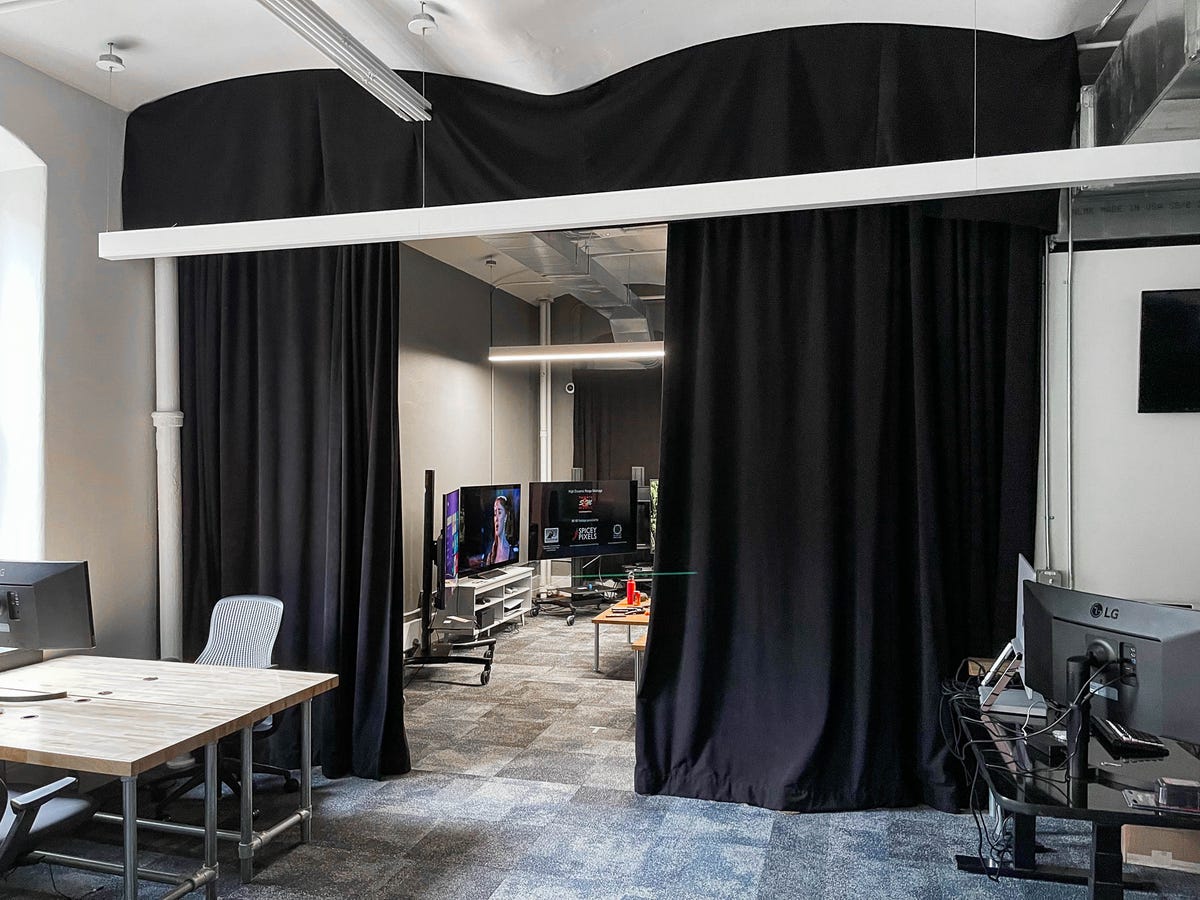
Curtains allow the lab to achieve perfect darkness and separate TV testing from the rest of CNET's NYC lab.
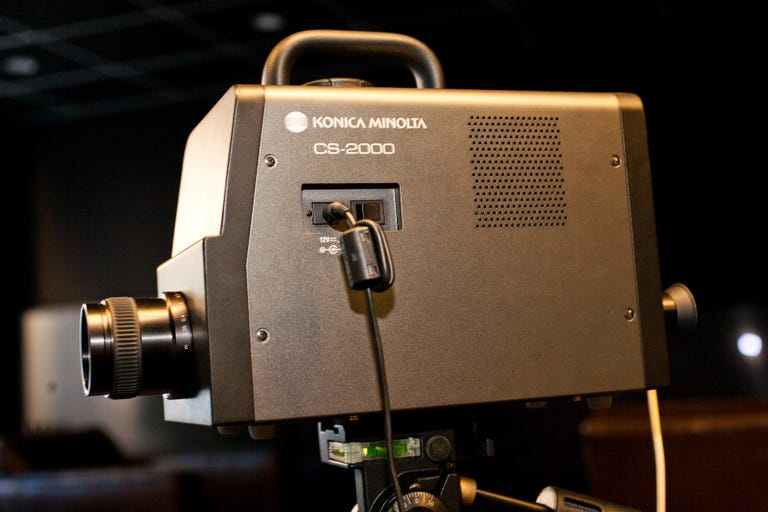
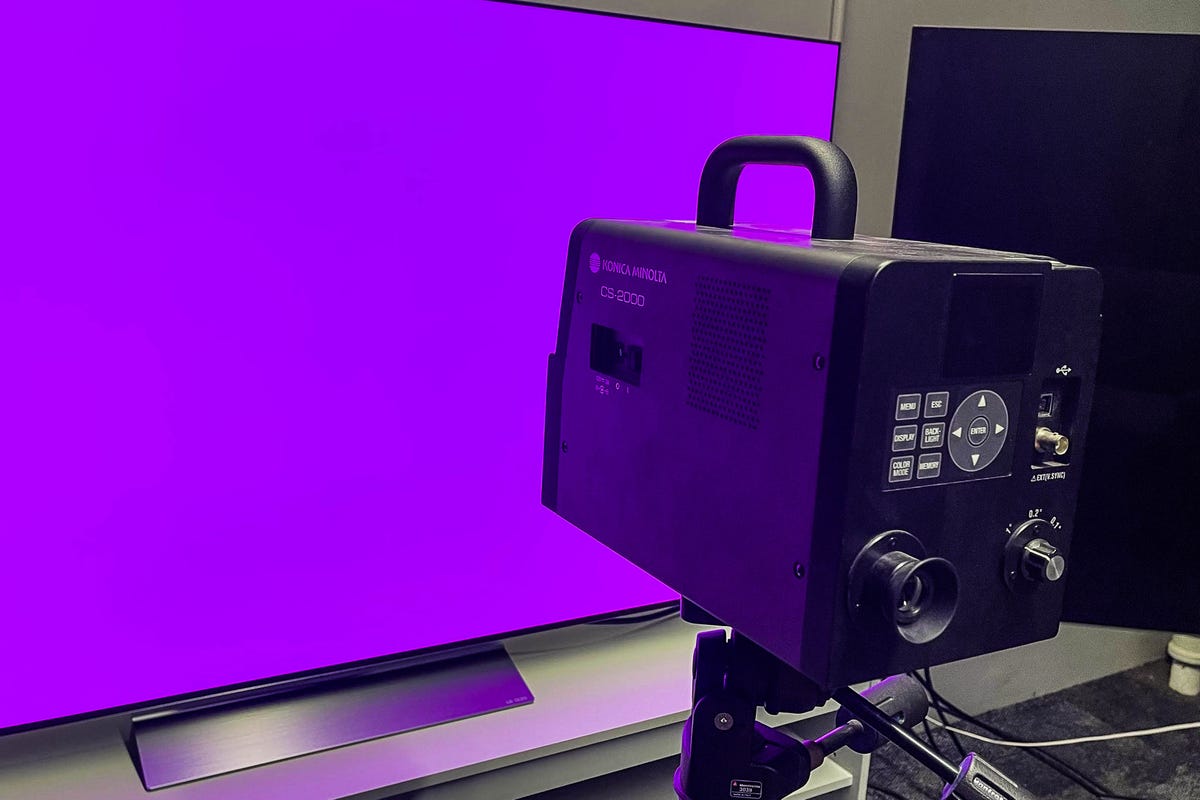
The Konica Minolta CS-2000.
Our primary mechanical test device is a Konica Minolta CS-2000 spectroradiometer (which costs about $28,000), one of the most-accurate devices of its kind. It measures luminance and color from any type of display, including OLED, LCD and LED-based flat panels.
Here's a list of our other test equipment and hardware:
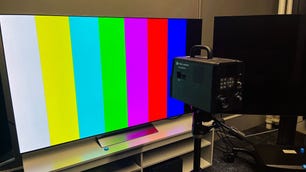
- Murideo 6G: A signal generator that outputs a variety of test patterns at various resolutions and formats, including 4K HDR and 1080p, via HDMI. This is the main generator we use for evaluation. Its test patterns primarily consist of windows of white, gray or color in the middle of a TV's screen, which are measured by the CS-2000 to evaluate the TV's capabilities.
- Secondary signal generators include the AVLab DVDO TPG and Quantum Data 780, which may be used for quick checks using their native patterns.
- Muideo 6A: A signal analyzer used to evaluate HDMI sources and devices for HDR, Dolby Vision and bandwidth.
- Konica Minolta LS-100: Highly accurate handheld luminance meter, used to spot-check luminance during comparisons and when using the larger CS-2000 is inconvenient.
- AVPro 8x8 4K UHD Matrix Switch: This HDMI distribution amplifier and switch can send any one of eight HDMI sources to as many as eight screens simultaneously without any signal degradation, or send separate sources to each display. We use this setup for side-by-side comparison testing.
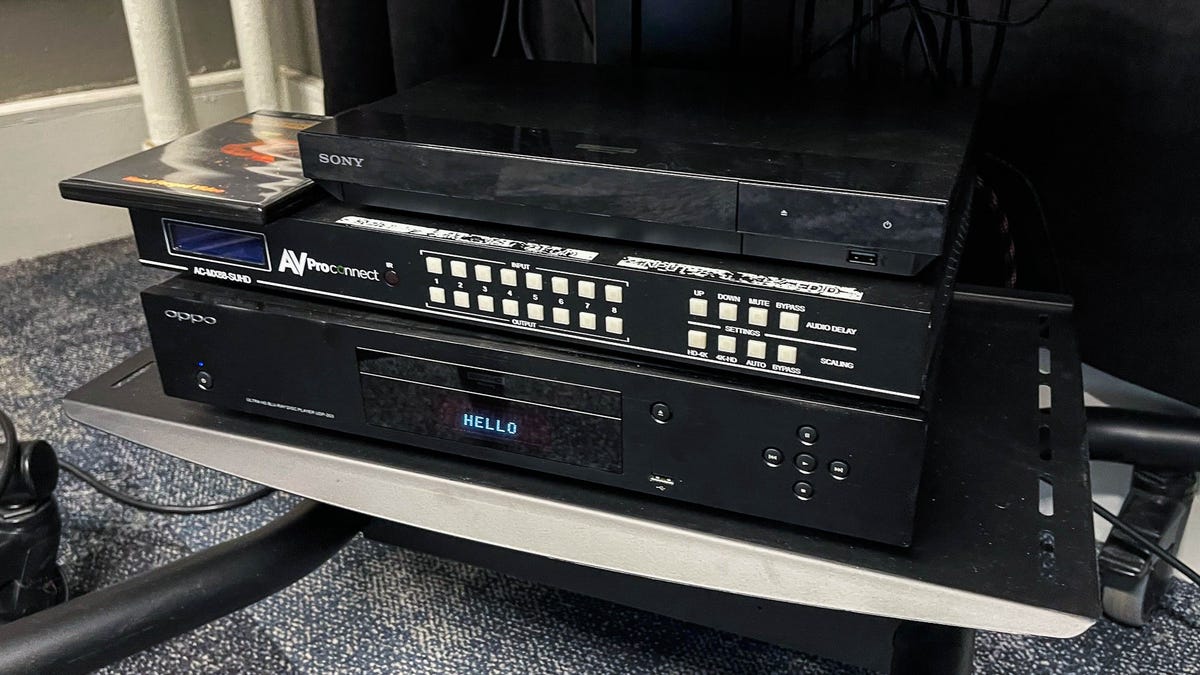
From top: Sony UXP-700 Blu-ray player, AVPro 8x8 4K UHD Matrix Switch and Oppo BDP-203 Blu-ray player.
- Leo Bodnar Lag Tester: Used to test input lag for gaming. For 4K HDR we use an HDFury Integral and Linker combination.
- Oppo BDP-203: Our primary 4K Blu-ray player, used for test disc playback as well as TV and movie comparisons.
- Sony UXP-700: Our secondary Blu-ray player. Since it lacks Dolby Vision support, we can use it with TVs that don't have Dolby Vision.
- Microsoft Xbox Series X: Used for gaming testing, including 4K/120Hz and VRR evaluation.
- Sony PlayStation 5: Used for gaming testing, including 4K/120Hz and VRR evaluation.
- Apple TV 4K: Used for TV and movie comparisons.
- Roku Ultra: Used for TV and movies comparisons.
- HDMI cables: We use Monoprice, Amazon Basics and Key Digital.
Here's a list of the reference and test software we use:
- Portrait Displays Calman Ultimate: This flexible software program controls both our spectroradiometer and signal generators via a laptop PC to aid in the evaluation process. Most of the figures in the CNET's TV reviews, including color, brightness, black level, gamma and more, are derived from its reports.
- Spears & Munsil HDR benchmark 4K Blu-ray: Our primary test Blu-ray disc. This includes a montage of 4K HDR footage as well as numerous test patterns used to augment the signal generators.
- FPD Benchmark Software for Professional (Blu-ray): Patterns from this disc are used to evaluate motion resolution.
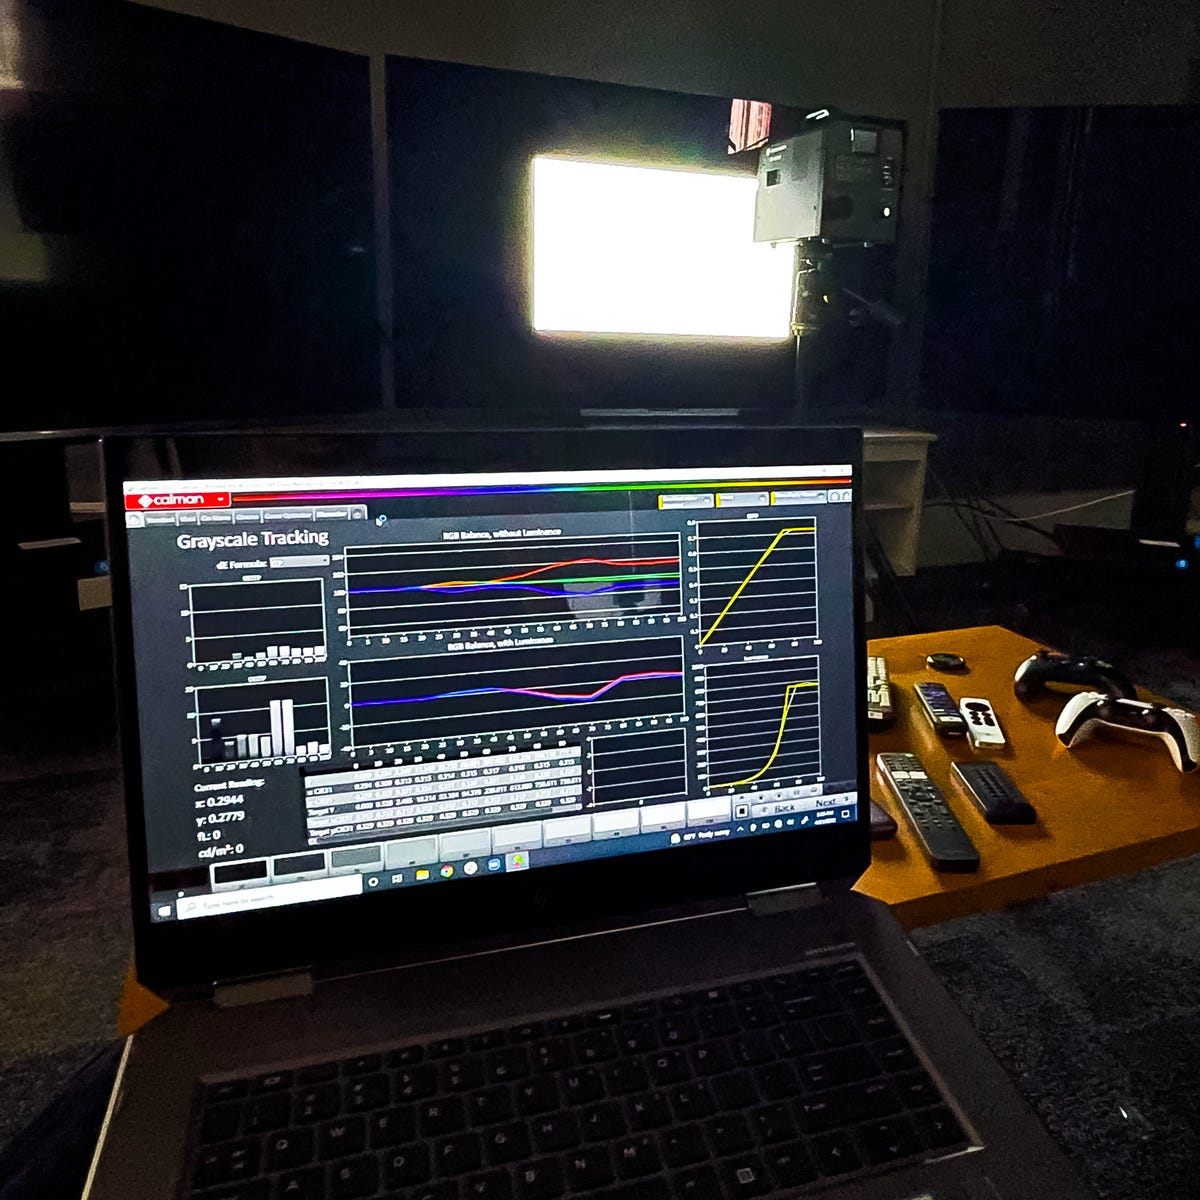
Portrait Displays Calman software controls the spectroradiometer and signal generator to measure a television.
TV review samples and series reviews
CNET TV reviews are based on one reviewer's hands-on experience with a single sample of one model and size. While our experiences are usually representative, we can't always be sure of that since performance can vary from sample to sample -- particularly if newer samples receive updated firmware, or if manufacturers make changes without updating the model name. We typically review models as quickly as possible, so we often receive early versions of firmware that are sometimes corrected later. However, we never review preproduction samples. All of the samples used in CNET TV reviews represent, as far as we can tell, shipping models.
CNET obtains most of its review samples directly from manufacturers, typically by an editor asking a public relations representative for the desired model. This, unfortunately, can lead to manufacturers sending non-representative samples, or even tampering with the units before they're sent, to help ensure better reviews. If we spot a blatant case of tampering, we'll note it in the review, but we can't always prove it (and in case you're wondering, no, we've never spotted a case of tampering that we could prove enough to mention in a review). If a manufacturer can't ship a sample or doesn't want us to review a particular set, we sometimes buy the model in question ourselves.
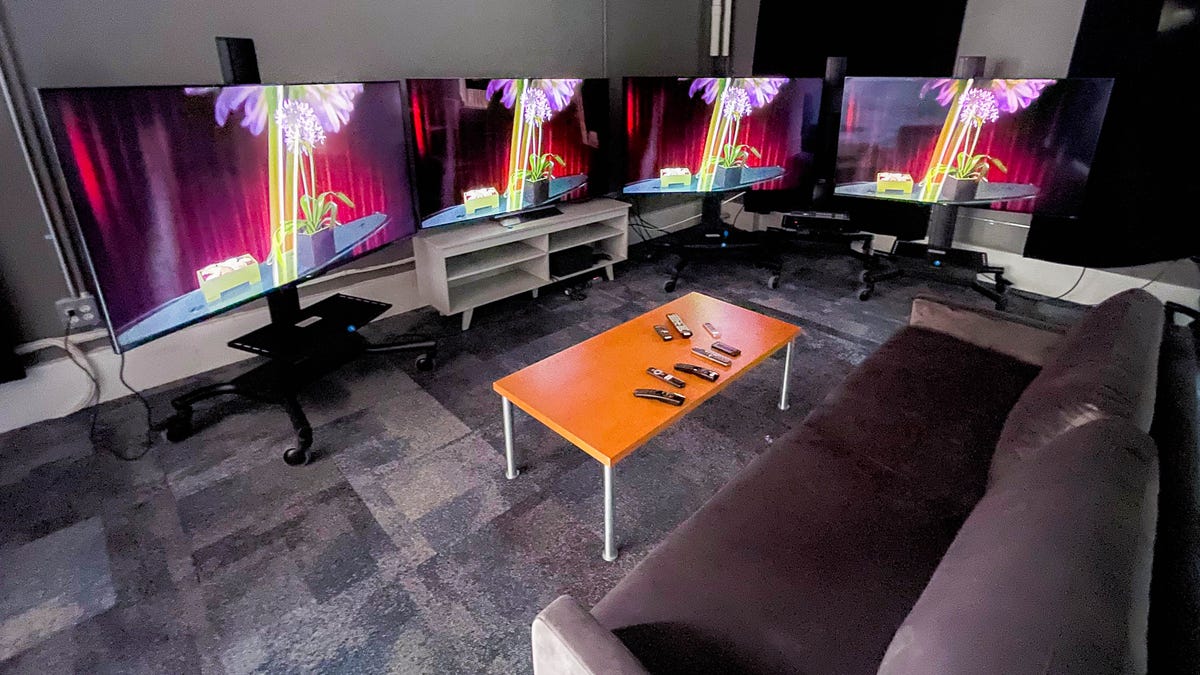
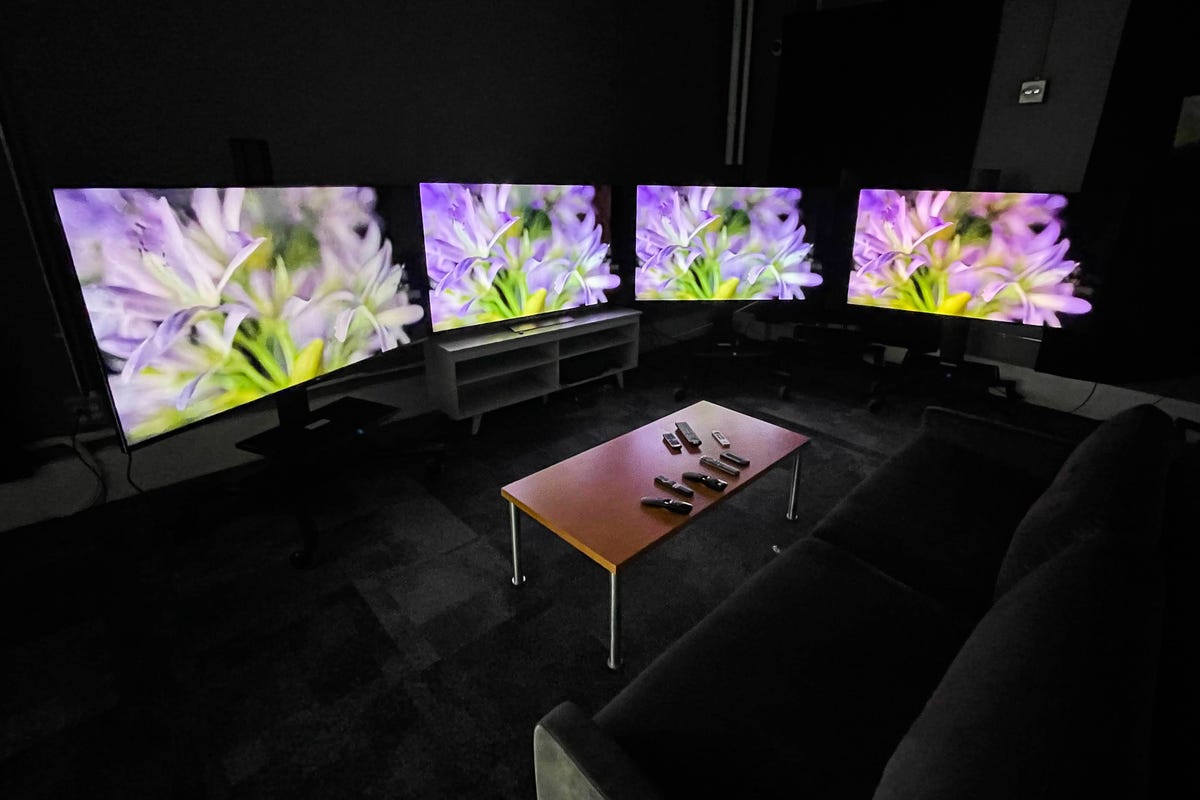
Side-by-side comparisons are the heart of CNET's TV reviews.
Test procedure
We strive to consistently test all TVs we review using the procedure below. In cases where not all of the tests are followed, we'll note the missing items in the review.
Aside from the bright-room portion of the test (see below), CNET TV reviews take place in a completely darkened environment. We realize that most people don't always watch TV in the dark, but we use a dark environment for a number of reasons. Most importantly, darkness eliminates the variable of light striking the TV's screen, which can skew the appearance of the image. It makes differences in image quality easier to spot, especially perceived black-level performance, which is severely affected by ambient light. Darkness also allows viewers at home to more easily match the reviewer's experiences. Finally, darkness is the environment we find most satisfying for watching high-quality material on a high-performance TV.
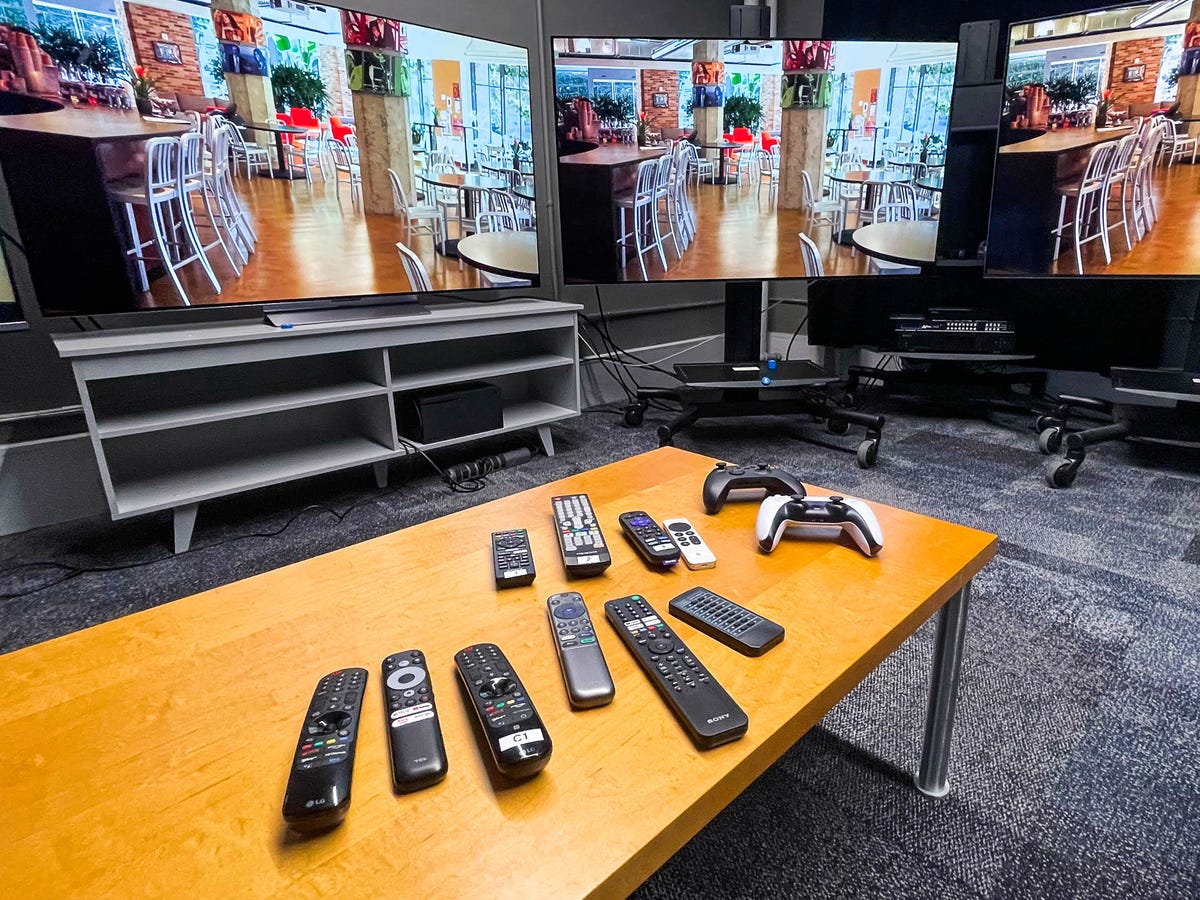
Lots of TVs and sources means lots and lots of remotes.
Measurement: As of the 2022 model year, we no longer calibrate the TVs we review. The main reason is that buyers are unlikely to pay for a professional calibration, so the measurements we take of the raw, uncalibrated picture settings provide a more representative comparison. There are a couple of other reasons for the change as well. First off, 4K and HDR material is becoming more common, and we never calibrated for HDR in the first place. We've also found that over the years, the most accurate preset picture modes have improved.
Once the TV is warmed up, we perform a series of measurements using the spectroradiometer and Calman software. The lens is set in the middle of the screen at a set distance (18 inches from the screen). We measure every picture mode for both SDR and HDR sources and choose the best and most accurate ones for my comparisons. In general the most accurate modes are Movie, Cinema or something similar, while the brightest are usually Vivid or Dynamic. We judge each mode's accuracy based on the accepted standards for color, gamma and HDR EOTF, or Electro-Optical Transfer Function, and report which modes are most accurate in the review.
We evaluate TV performance both under lights and in the dark.
Side-by-side comparison: Every TV CNET reviews is compared with others in the room during the evaluation. This is a direct, side-by-side comparison; the TVs are literally lined up next to one another and compared in real time, with the reviewer recording observations on a laptop computer. We feed numerous sources through the AVPro distribution amplifier -- a device that can feed multiple TVs the exact same signal with no degradation. The TVs being compared often share similar prices, screen sizes and other characteristics, but can just as often be more or less expensive or have different characteristics to better illustrate major differences (such as between LCD and OLED, or an extremely expensive set versus a less-expensive model).
These comparisons allow CNET to make definitive, in-context statements about virtually every area of a TV's performance.
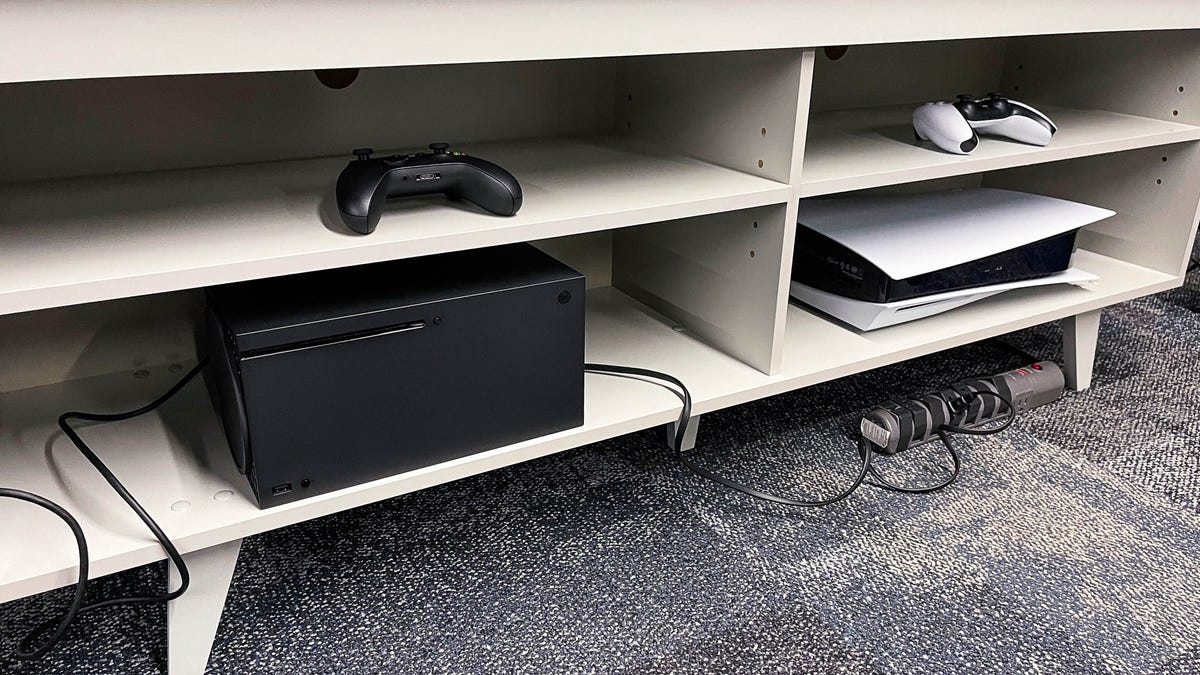
Gaming tests help determine how TVs can take advantage of the latest console's features.
Image-quality tests: We perform a broad range of tests on all televisions we review, organized into a few key categories.
- TV and movies: We watch HDR and standard dynamic range examples of TV shows and movies, as well as reference video from the Spears & Munsil benchmark disc, and note differences.
- Gaming: We play a variety of games, typically from an Xbox Series X or PlayStation 5, and note the effects of gaming modes and settings as well as the 4K/120Hz and VRR input capabilites. We also measure and report input lag.
- Bright lighting: We turn on the lights in our testing area and open the windows in the daytime to see how the TV handles ambient light. We note the screen's reflectivity compared with its peers, as well as its ability to maintain black levels. This section also includes a table showing objective brightness measurements or various picture modes, using the standard 10% window.
- Uniformity and viewing angle: We use this section to address uniformity across the screen, making subjective observations with full-raster test patterns, letterbox bars and flat-color scenes. We also talk about off-angle viewing in this section, using similar material and subjective comparisons.
The Leo Bodnar input lag tester.
Picture settings notes and Geek Box
At the end of the TV review you'll find our recommended picture mode as well as any additional notes on which settings delivered the most accurate picture for us. We no longer list specific numeric settings because they can vary from sample to sample.
The Geek Box is where we put many of the objective results we attain from measurements. It's been overhauled continually over the years as our testing evolves and is somewhat shorter in 2022 (we replaced the individual color measurements with a simple average, for example).
The box contains three columns: Test, Result and Score. Each test is detailed below. The result of each test is either numeric or pass-fail. Each score is either Good, Average or Poor. We determined the cutoffs for those scores based on guidelines in the Calman software, data gathered from past reviews and editorial discretion.
The color and saturation results list error levels, namely DeltaE 2000 as reported by Calman, compared to the industry reference. Results of 3 or lower are Good, 5 or lower Average and higher than 5 Poor.
Color measurements, among others, are reported in the Geek Box.
Other than color, the Geek Box also reports:
Black luminance (0%): This is the black level in nits from a custom test pattern (User Defined window with Pattern Size 15, Pattern APL 10 on the Murideo SixG) using the most accurate SDR and HDR picture mode. Good is 0.27 or less, Average 0.65 or less and Poor is anything Brighter.
Peak white luminance (10% win): This is the maximum brightness in nits using the brightest (but not necessarily the most accurate) SDR and HDR picture mode. Good is 500 or higher (1,000 for HDR), Average is 300 or higher (700 for HDR) and Poor is anything dimmer.
Avg. gamma (10 to 100%): Only reported for SDR, this measures the progression from dark to bright compared against the 2.2 standard. Deviations of 0.1 or lower are Good, 0.2 or lower Average and higher than 0.2 Poor.
Input lag: Unless otherwise noted in the review, this is the lowest (fastest) lag measurement in milliseconds for SDR and 4K HDR sources, typically using the TV's game mode.
Gamut % UHDA/P3 (CIE 1976): Only reported for HDR, this is the P3 color gamut coverage using the CIE 1976 color space. 95% or higher is Good, 90% or higher Average and less than 90% Poor.
Note that while these numbers and scores are useful, they don't necessarily represent the full picture quality of a display, and we consider many other factors when arriving at the numeric performance score in a CNET review.